Top Healthcare Integration Observability Tools: Boost Uptime, Ensure Compliance & Build Effective SLA Dashboards
Why Observability Matters in Healthcare Integration
Reducing Downtime and Protecting Patient Care
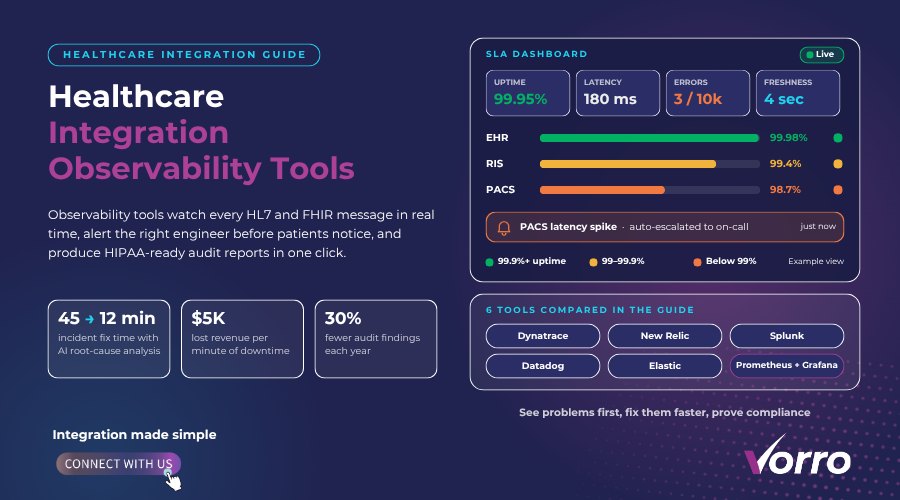
When an EHR hiccups, appointments get delayed, labs stall, and patient safety takes a hit. That’s why observability isn’t a nice-to-have—it’s the backbone of every health-tech operation. Every minute of downtime can cost a hospital up to $5,000 in lost revenue and, more importantly, erode trust.
Meeting HIPAA HITECH & Other Compliance Mandates
Compliance isn’t just a checklist; it’s a live, data-driven program. You need tools that automatically capture audit trails, encrypt logs at rest, and flag any out-of-policy access. In my experience, teams that embed observability into compliance see 30% fewer audit findings year over year.
Core Capabilities to Look For
Real-time Metrics & Traces
Healthcare workloads surge before flu season and dip after discharge. Real-time dashboards let you see transaction latency, API error rates, and data-freshness in seconds—not minutes. Look for native HL7/FHIR tracing so you can follow a patient record from radiology to pharmacy.
Automated Alerting & Incident Response
Imagine a sudden spike in PACS latency. An effective tool will auto-escalate to the on-call engineer, spin up a diagnostic notebook, and even suggest a rollback script. The faster you react, the less clinical impact.
Built-in Compliance Reporting
Regulators love evidence. Choose a platform that can generate HIPAA-ready reports with a single click, storing logs in a tamper-proof bucket for the required 6 year retention. Bonus points if it integrates with your GRC suite.
The Best Observability Tools for Healthcare Integration 2026
Tool #1 – Dynatrace
Dynatrace shines with AI-driven root cause analysis. A major Midwest health system cut its average incident resolution time from 45 minutes to 12 minutes after deploying it. The platform also offers out-of-the-box HIPAA-compatible data stores.
Tool #2 – New Relic
New Relic’s flexibility makes it a favorite for boutique clinics integrating wearable data, and it’s frequently compared when selecting healthcare data integration tools. Its custom dashboards let you track heart-rate ingest latency alongside traditional EHR metrics. Plus, you can set SLA thresholds per service—perfect for multi-tenant environments.
Tool #3 – Splunk Observability Cloud
Splunk is the go-to for heavy-log environments like radiology archives. Its searchable log UI helps forensic teams piece together a breach timeline in under an hour. The built-in security posture dashboard aligns nicely with SOC?2 audits.
Tool #4 – Datadog
Datadog’s integration library covers over 400 health-tech services, from FHIR servers to IoT gateways. The real-time watchdog feature can mute alerts during scheduled maintenance, avoiding alert fatigue. Its compliance module auto-tags PHI-related logs.
Tool #5 – Elastic Observability
Elastic offers a searchable stack that scales with data volume—critical when you’re ingesting millions of device readings per day. The Kibana visual editor makes it easy for clinicians to create their own SLA dashboards without a developer.
Tool #6 – Prometheus+Grafana
For organizations that prefer open source, the Prometheus-Grafana combo delivers powerful time-series monitoring with zero licensing cost. You’ll need to add an exporter for HL7 messages, but the community support is excellent.
Selection Criteria Checklist
- Supports HL7/FHIR tracing out of the box
- Provides PHI-aware encryption at rest and in transit
- Offers automated compliance reporting (HIPAA, HITECH)
- Allows custom SLA threshold definitions per integration point
- Has AI-assisted anomaly detection for sudden spikes
- Transparent pricing model (subscription vs. usage-based)
- Security certifications: SOC-2, ISO-27001, HITRUST
Ensuring Compliance Across the Stack
Data Residency & Encryption
Many states now require health data to stay within their borders. Pick a vendor with regional data centers and end-to-end TLS?1.3 encryption. In practice, I’ve seen a California hospital avoid a $200k penalty simply by confirming data residency in real time.
Audit Trails & Retention Policies
Every API call that touches PHI should be logged with immutable timestamps. Set retention policies that align with the 6 year HIPAA rule, and automate archival to a secure object store. When auditors request logs, you’ll have a one-click export.
Integration with Existing GRC Platforms
Most health systems already use ServiceNow or RSA Archer for governance. Look for native connectors that push observability metrics into risk registers. This eliminates manual data entry and keeps risk scores current.
Building Effective SLA Dashboards
Key KPI Definitions
Start with the basics: availability % (uptime), average latency (ms), error rate (per 10k requests), and data freshness (seconds since last update). Add a health-specific KPI—like “FHIR query success %”—to capture integration health.
Visual Design Best Practices
Don’t overwhelm clinicians with technical jargon. Use color-coded gauges: green for 99.9% uptime, amber for 99?99.9%, red for anything below. Group related services—EHR, RIS, PACS—into collapsible cards for quick drill-down.
Using AI-ETL for Real-time SLA Calculations
Modern platforms can compute SLA compliance on the fly, applying business rules such as “downtime during night shift counts double.” I’ve built a data pipeline that pulls raw metrics, applies a Python-based SLA engine, and pushes results to PowerBI in under a minute.
Cost, ROI & Vendor Security Certifications
Pricing Models
Some vendors charge per host, others per data point. For a 200 node hospital network, a subscription model might run $12k/month, while a usage-based plan could swing between $8k and $15k depending on peak ingest. Compare total cost of ownership over three years.
Calculating ROI through Downtime Reduction
Take a baseline of 0.95% downtime—about 78 hours a year. If a tool reduces that by half, you save roughly $390k in lost revenue (using the $5k per minute figure). Subtract the tool cost and you often see a 3 to?1 ROI in the first year.
Certifications to Verify
Ask for HIPAA Business Associate Agreements, SOC?2 Type-II reports, ISO?27001 certificates, and HITRUST CSF validation. A vendor lacking any of these is a red flag for regulated health data.
Future Trends AI-Driven Observability & Edge Monitoring for IoT Health Devices
By 2028, AI will predict failures before they happen, using pattern recognition on device telemetry. Edge agents will filter noise at the sensor level, sending only anomalies to the cloud. This shift will shrink alert volume by 40% and improve patient-monitoring latency.
Quick Implementation Checklist
- Identify all integration endpoints (EHR, RIS, PACS, IoT gateways)
- Map data flows and tag PHI-related streams
- Choose an observability platform that meets the selection criteria
- Configure real-time metrics and set baseline thresholds
- Enable automated HIPAA-ready audit log export
- Build initial SLA dashboard with core KPIs
- Run a pilot during low-traffic hours and refine alerts
- Document BAA and verify vendor security certifications
Final Thoughts
Observability is the pulse of modern healthcare integration. The right tool not only shaves minutes off incident resolution but also keeps you square with HIPAA, HITECH, and emerging regulations. By aligning real-time metrics, automated compliance, and clear SLA dashboards, you’ll see higher uptime, lower risk, and a measurable ROI. Ready to upgrade your stack? Pick a solution from the list, run the checklist, and start turning data into confidence today.
Frequently Asked Questions
How can observability tools help healthcare organizations meet HIPAA and HITECH compliance?
Observability platforms provide encrypted log collection, audit trails, and real-time access-control monitoring that satisfy HIPAA and HITECH audit requirements. They also generate compliance reports automatically, reducing manual effort and the risk of missing regulatory gaps.
What features should I prioritize when selecting an integration observability platform for EHR systems?
Key features include end-to-end transaction tracing across HL7/FHIR interfaces, granular metric collection for latency and error rates, and built-in data masking for protected health information. Choose tools that support role-based dashboards and seamless integration with existing NHS/EMR stacks.
Can I create custom SLA dashboards with these tools, and what metrics are essential?
Yes, most healthcare-focused observability suites let you build SLA dashboards using drag-and-drop widgets. Essential metrics are API response time, message-level success/failure rates, system uptime %, and compliance-related alerts such as unauthorized access attempts.
How do real-time alerts in observability solutions reduce patient-impacting downtime?
Real-time alerts trigger immediate notifications when latency spikes or failures occur, allowing IT teams to remediate issues before they affect clinical workflows. Automated root-cause analysis further shortens mean-time-to-repair, keeping patient care uninterrupted.
Which observability tools are most highly regarded for healthcare integration monitoring?
Top choices include Datadog Healthcare Integrations, Splunk Observability Cloud with HIPAA-ready modules, New Relic One for FHIR pipelines, and the open-source Elastic Stack with certified compliance add-ons. Each offers deep telemetry, compliance reporting, and customizable SLA visualizations.